
On April 2, 2025, President Trump announced sweeping import tariffs on all U.S. trading partners. Dubbed “Liberation Day,” the policy imposed a 10% baseline rate across the board, with steeper levies targeting China, Cambodia, Vietnam, and other key manufacturing hubs.
The home furnishings sector felt the impact almost immediately. Stocks collapsed in the days that followed—then sharply reversed a week later when the administration announced a 90-day pause. For investors tracking the divide between AI-Driven and Traditional retailers that we have examined in prior research, the market whiplash raised the question: Do the operational advantages that insulate AI-Driven firms from slower-moving macro headwinds hold up under acute policy shocks?
The short answer is yes—but with an important caveat. AI-Driven home furnishers were not spared from the initial drawdown. If anything, they absorbed the first blow harder. What ultimately set them apart wasn’t immunity to the shock, but everything that came after.
The Stress Test
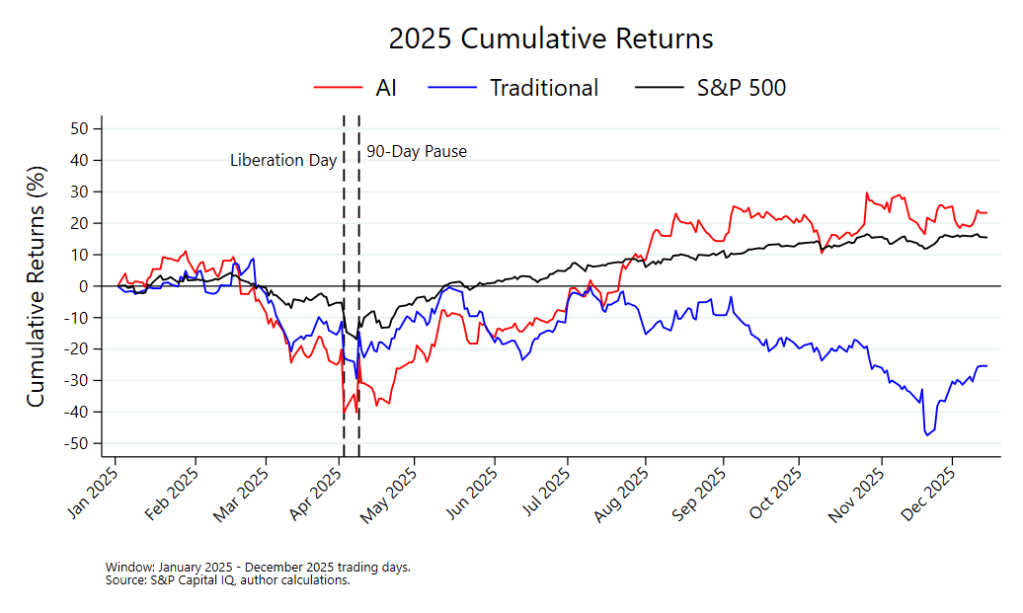
For this analysis, we tracked cumulative returns for market-cap-weighted portfolios of AI-Driven and Traditional home furnishers throughout 2025.
From late March to early April, both AI-Driven furnishers and Traditional entities were down materially year-to-date. Liberation Day intensified the selloff. AI-Driven entities took the sharper initial hit, exhibiting a severe single-session drop that pushed the group to a trough of roughly -40% in cumulative returns during early April. Traditional furnishers fell too, though their initial drawdown was less severe in percentage terms.
The ultimate divergence began on April 9th. When the administration announced its 90-day pause, the AI-Driven group snapped back quickly and with conviction. Volatility persisted through the spring, but the trajectory was clear. Losses narrowed materially, and by mid-July, the group had crossed back into positive territory. By mid-December, AI-Driven furnishers had climbed to cumulative gains of roughly +20–25% .
Traditional furnishers followed a different path. Although the pause triggered a modest rebound, momentum faded. Through the second half of the year, the group trended downward, ultimately finishing deep in negative territory—approximately -25% by late December.
What separated the two cohorts wasn’t how hard they were hit. It was whether they could recover—and how quickly.
What Changed in 2025
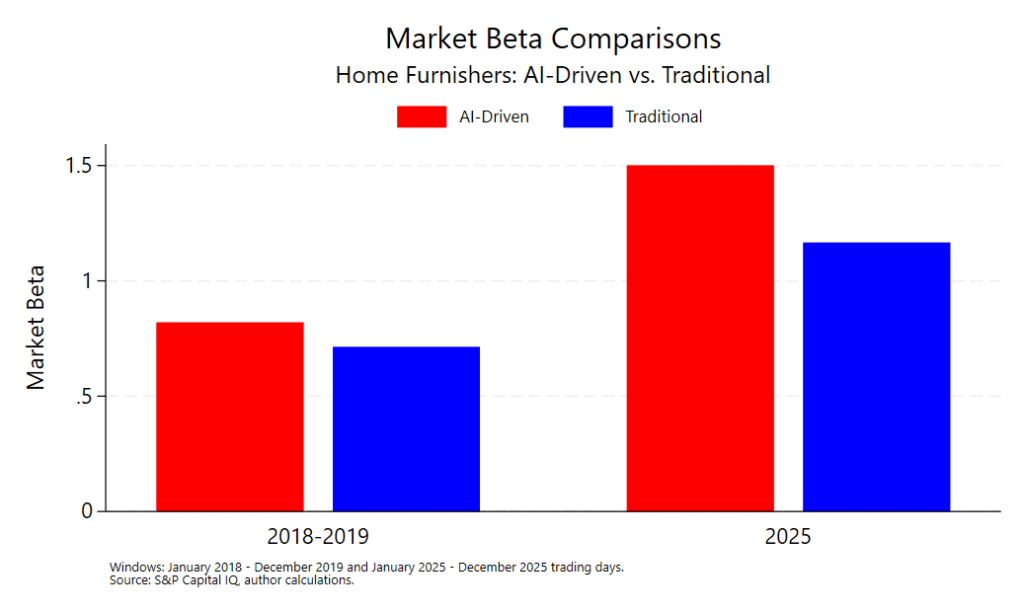
The beta estimates reveal fundamentally different market-reactivity structures between the two groups.
During the first major tariff standoff of the Trump administration in 2018 and 2019, both groups exhibited sub-market betas—0.82 for AI-Driven furnishers and 0.71 for Traditional retailers. They were directionally tied to the broader market but experienced less volatility.
In 2025, that dynamic flipped. Market betas increased substantially. AI-Driven furnishers posted a beta of 1.5, while Traditional retailers registered around 1.15. Rather than decoupling from the market, both cohorts became more sensitive to broad equity movements—particularly in the AI-Driven group.
This suggests that 2025 price action wasn’t driven by isolated tariff headlines alone. Instead, the home furnishing space became more tightly integrated with overall market dynamics. AI-Driven firms in particular traded with amplified cyclicality relative to the S&P.
VIX sensitivity—often referred to as the “fear gauge”—adds an additional layer to this shift. Both groups became more reactive to volatility spikes in 2025 compared to 2018-2019. However, Traditional furnishers displayed a more negative volatility loading compared to the AI-Driven group (approximately -0.57 compared to -0.50, respectively). In other words, when volatility surged, Traditional entities absorbed more of the blow.
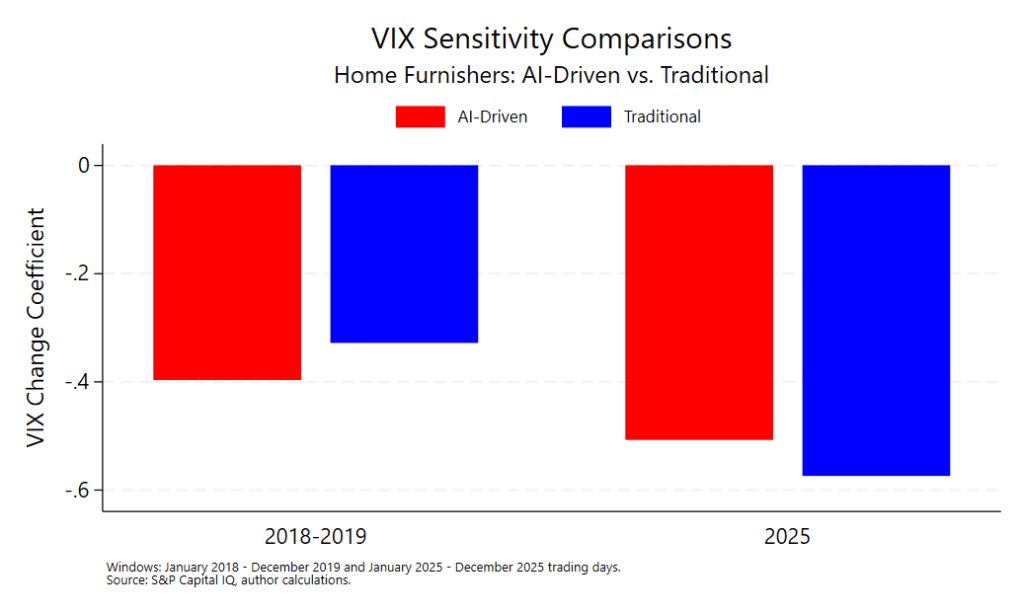
Taken together, 2025 was not characterized by market insulation, but by higher systemic exposure combined with meaningful sensitivity to fear shocks.
Why Recovery Diverged
The pattern aligns with what we documented in our broader deep-dive analysis, though the mechanism is more precise than initially framed.
AI-Driven furnishers exhibit faster mean reversion and more dynamic repricing behavior, and Liberation Day illustrates how that plays out under stress. Their elevated beta in 2025 meant steeper losses when markets sold off. But that higher systemic sensitivity operated in reverse when conditions became more favorable.
As volatility moderated and broader equity sentiment improved, AI-Driven entities participated more forcefully in recovery. Their operational infrastructure—ML-powered demand forecasting, dynamic pricing, and real-time supply chain visibility—likely supported quicker fundamental recalibration. But in equity-market terms, their higher market beta also amplified upside participation.
Traditional furnishers—which carry a lower beta but slightly heavier volatility drag—didn’t rebound to the same degree. Recovery attempts stalled as macro uncertainty lingered. Operational differences may have played a role, but market structure alone—lower beta and higher volatility sensitivity—helps explain the asymmetry in cumulative outcomes.
The divergence, therefore, was not about avoiding volatility. It was about how volatility translated into cumulative performance over multiple cycles of shock and stabilization.
Caveats
Our sample includes twelve entities—five in the AI-Driven group, and seven in the Traditional group—which limits statistical power. While the magnitude of 2025 betas is materially higher than in 2018-2019, confidence intervals remain wide. Late-year weakness among Traditional furnishers may also reflect firm-specific developments beyond tariff exposure or volatility sensitivity.
Takeaway
AI-Driven furnishers were not immune to Liberation Day. In fact, their higher 2025 beta produced sharper drawdowns during acute market stress compared to their Traditional peers.
The group’s competitive edge emerged over time. Higher systemic sensitivity allowed AI-Driven retailers to participate more aggressively in rebounds, while slightly lower volatility drag helped prevent extended downside spirals. The result was not reduced volatility—it was faster cumulative recovery.
Investors expecting these firms to shrug off policy shocks may be surprised by the severity of initial declines. But the more relevant question isn’t who fell less—it’s who converted stabilization into sustained growth.
______________________________________________________________________________
Methodology: Market models estimated using daily close price returns from January 2018 – December 2019, as well as January – December 2025, with Vanguard’s S&P 500 ETF (VOO) as benchmark. VIX was sourced from FRED’s VIXCLS series.
Data: S&P Capital IQ (daily close prices), Federal Reserve Economic Data.
