
In February, we released our second report in a four part series examining the AI advantage in the home furnishings sector. That deep dive documented a structural gap between AI-Driven and Traditional home furnishers: AI-Driven firms’ superior business fundamentals result in cleaner volatility profiles, stronger excess returns, and materially better positioning during seasonal headwinds. This supplementary piece investigates whether the market’s collective sentiment acknowledges and aligns with our findings.
Short interest data offers one lens. When investors short a stock, they are betting against it. The proportion of shares sold short, and the stability of that proportion over time, reveals something about how the market views a company’s trajectory. If AI-Driven furnishers truly exhibit the structural advantages documented in our regression, risk, and return analyses, we would expect short positioning to reflect that. In other words, we’d expect lighter bets against AI-Driven firms, and less churn in those positions.
Lighter and Steadier
It’s important to note that short interest as a percentage of shares outstanding has trended downward for both groups over the past five years. But the AI group remains consistently lower, and the gap has recently widened. The Traditional group peaked around 160% of its normalized baseline in early 2022 before declining sharply, while the AI-Driven group never approached those levels and has continued a steady descent.
The volatility of these ratios differs as well. Traditional short interest whipsaws considerably, with sharp spikes and reversals that mirror the group’s broader volatility profile. AI-Driven short interest, on the other hand, moves more gradually. This pattern echoes what our ARCH/GARCH/TARCH analysis found: Traditional firms exhibit greater shock sensitivity and slower mean reversion in their return volatility, and the short market appears to price that instability into its positioning behavior.
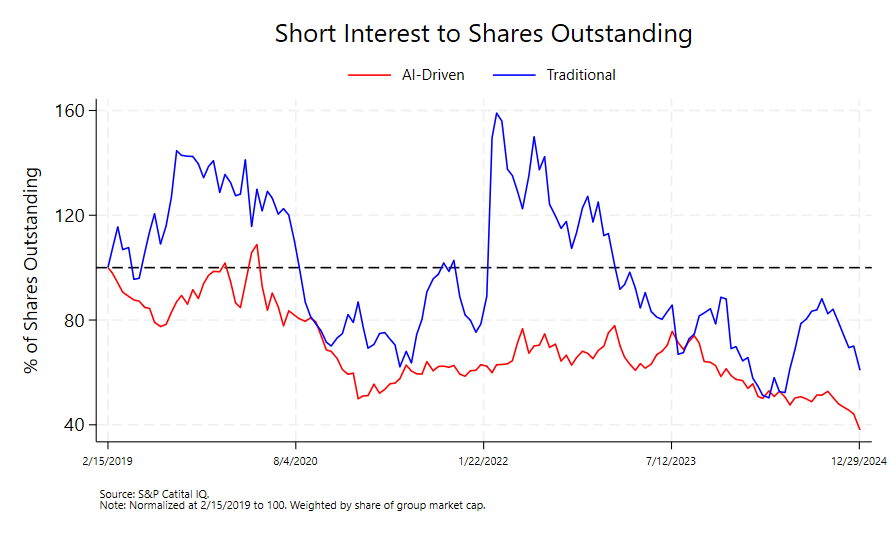
The takeaway is straightforward. The market bets against AI-Driven furnishers less frequently, and when sentiment does shift, it shifts more gradually. This is consistent with higher medium- and long-term confidence in AI-Driven firms’ strategic positioning. It also suggests that AI integration across operations, targeting, and logistics reduces the fundamental uncertainty that typically attracts short sellers looking for mispricing opportunities.
Stickier Conviction
The days-to-cover (DTC) ratio tells a complementary story. DTC measures how many days of average trading volume would be required for all short positions to close out. A higher DTC typically indicates fewer but stickier short positions—often institutional investors with longer time horizons making calculated bets on business fundamentals over quarters or years, not day traders cycling in and out.
The AI-Driven group consistently shows higher DTC than Traditional counterparts across the sample period. At first glance, this might seem concerning. A higher DTC can indicate greater squeeze risk if shorts are forced to cover into a rising market. But context matters. Because overall short interest is lower for the AI-Driven group, the absolute number of shares sold short is smaller. Through this lens, a higher DTC reflects composition rather than crowding. The shorts that do exist are stickier and more patient, not more numerous.
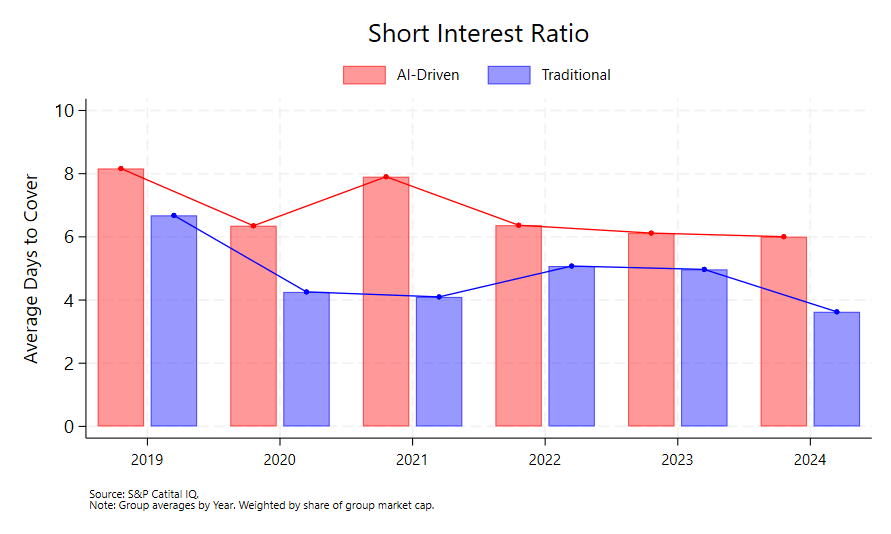
More telling than the level is the stability. AI-Driven DTC behaves steadily over time, while Traditional DTC fluctuates more substantially. This aligns with the broader pattern in which positioning around AI-Driven firms is both lighter and calmer. Short sellers appear to approach these names with consistent strategies rather than rapidly adjusting their views in response to emerging headlines or quarterly noise.
Taken together, lower short interest and higher, steadier DTC point to a specific investor profile on the bearish side of AI-Driven trades—fewer in number, larger in size, and longer in horizon. This is strategic positioning, not fast-money speculation. Paradoxically, it signals that even skeptics treat AI-Driven firms as businesses with predictable trajectories worth monitoring over extended periods of time rather than volatile names to trade around.
Testing Stability Directly
To formalize this observation, we ran a panel regression of monthly DTC volatility with an AI-Driven group indicator and appropriate controls, clustering standard errors to account for within-group correlation.
The AI-Driven indicator coefficient came in at approximately -0.347. The result is directional rather than statistically significant, which is unsurprising given the sample size and inherent noise in short interest data. But the sign matters. It suggests that AI-Driven short positioning is more stable month-to-month compared to Traditional positioning, even after controlling for other factors that might drive volatility in DTC.
This finding aligns with the broader analysis. The lower ARCH effects we documented in the deep dive study indicates that AI-Driven firms experience less day-to-day shock sensitivity in their returns. The TARCH results show less asymmetric reactions—or fewer panic spirals—to “good” versus “bad” news. And, the GARCH results show lower volatility persistence, meaning shocks fade faster. Now, the short interest data shows the same pattern on the positioning side—investors betting against AI-Driven firms do so with more consistent conviction rather than reactively adjusting their views.
The regression result is not definitive on its own, but it does add another data point to a pattern that has emerged consistently across every dimension we have examined. AI-Driven furnishers attract more stable positioning from bullish and bearish investors alike.
Implications for Price Discovery
These patterns have practical implications for how AI-Driven and Traditional furnishers behave under stress.
Consider what happens when negative news hits a stock with high and volatile short interest. Shorts pile in, amplifying the initial decline. As the stock falls, more momentum-oriented shorts join. Eventually the move exhausts itself, and shorts begin covering—amplifying the reversal. Price action becomes a function of flow dynamics as much as fundamental information. The signal-to-noise ratio deteriorates.
Traditional home furnishers face this dynamic more acutely. Higher short interest means more fuel for momentum-driven selloffs. More volatile positioning means faster cycling in and out of positions. The result is price discovery that gets contaminated by technical flows.
AI-Driven furnishers face less of this contamination. Lower short interest means there’s a smaller base of potential sellers during stress. Stickier positioning means those sellers are less likely to pile in reactively. Higher DTC means covering, when it happens, is more gradual. The result is that price movements in AI-Driven equities more cleanly reflect changes in fundamental expectations rather than flow-driven noise.
This connects directly to the volatility findings from the main analysis. We documented that AI-Driven firms exhibit more memory-dominated volatility, meaning their price movements are driven more by slow-moving fundamentals rather than transitory shocks. The short interest data helps explain why: when the investor base betting against a stock is inherently stable and has a longer time horizon, the flow-driven component of price action shrinks.
What the Bears Are Telling Us
There is an irony in these findings. Short sellers are, by definition, skeptics. They believe a stock is overvalued and are willing to pay borrowing costs while assuming unlimited downside risk to express that view. When short sellers treat a stock as a long-horizon fundamental bet rather than a volatile trading opportunity, they are implicitly acknowledging that the business has a predictable trajectory worth analyzing carefully.
The AI-Driven group attracts this kind of short interest. The Traditional group attracts something messier—higher levels, more volatility, faster turnover. This distinction mirrors what we found in the return analysis. Post-Q3 2022, AI-Driven firms flipped from negative to positive excess returns relative to the S&P and have maintained that outperformance with lower volatility. Traditional firms have remained in negative territory with higher dispersion. The short market appears to have noticed the same divergence and positioned accordingly.
Of course, none of this means AI-Driven furnishers are immune to bearish pressure—only that when the pressure does come, it does so from investors who have done their homework and are prepared to wait. That is a fundamentally different challenge than facing a crowded short base prone to rapid repositioning.
Connection to the Broader Findings
The short sentiment data reinforces the central theme of our deep dive analysis. AI-Driven home furnishers exhibit structural advantages that manifest across multiple dimensions—returns during seasonal headwinds, excess momentum, lower shock sensitivity, faster mean reversion, and now, lighter and steadier short positioning. These are not independent observations—they reflect the same underlying reality.
Operational infrastructure built on real-time data, ML-powered demand forecasting, dynamic pricing, and supply chain optimization translates into more predictable business performance. More predictable performance attracts longer-horizon capital and repels reactive short-term trading. Cleaner investor bases produce cleaner price action. Cleaner price action reinforces the perception of stability, which further attracts patient capital.
This is a virtuous cycle that Traditional firms—with their legacy systems and manual processes—struggle to access. The market appears to have noticed. The short interest data is simply the latest confirmation.
______________________________________________________________________________
Methodology: Short interest and shares outstanding data are market-cap-weighted by group and normalized to 100 at sample start. Days-to-cover calculated as short interest divided by average daily trading volume, averaged annually by group and weighted by market capitalization. Panel regression of monthly DTC volatility includes AI-driven group indicator with clustered standard errors; coefficient of -0.347 is directional but not statistically significant.
Data: S&P Capital IQ.
